Volume 4, Number 1 – February 2005
The Science Education Review
Ideas for enhancing primary and high school science education
harry @ smartscience.net
Abstract
Francis Bacon began defining scientific methodology in the early 17th century, and secondary school science classes began to implement science labs in the mid-19th century. By the early 20th century, leading educators were suggesting that science labs be used to develop scientific thinking habits in young students, and at the beginning of the 21st century, educators are still seeking to achieve this goal. Technology offers one path to success. Yet, the numerous “virtual labs” available offer little, or no, practice in scientific thinking. This paper presents a new approach to using technology, one that uses real experiments and provides students with the opportunity to think like scientists.
NOTE: Portions of this paper have been altered to account for changes since 2005.
Introduction
Engaging kindergarten to Year 12 students in scientific processes is central to science education reform (Handelsman et al., 2004; Trautman, Avery, Krasny, & Cunningham, 2002). Yet, teachers at all levels have failed to provide students with lab experiences that truly incorporate scientific methodologies (Handelsman et al., 2004; Harlen, n.d.; Sagan, 1996; Trautman et al., 2002; Westaway, 1919).
Technology can play a key role in improving science teaching (Bruder, 1993; Friedrichsen, Dana, Zembal-Saul, Munford, & Tsur, 2001; Woodrow, Mayer-Smith, & Pedretti, 2000), and this paper introduces one technology-based approach to provide lab experiences with scientific processes built in. Science laboratories will be presented in historical context to identify current classroom needs. The use of computers as a means to present virtual demonstrations and laboratories will be reviewed as a potential solution, with reference to one particular approach, the Smart Science (Smart Science Education 2004) education system, developed by the authors and their associates.
Early Science Laboratories in Education
Frederick William Westaway was a noted writer who authored 16 books on science and scientific method. Edgar Jenkins (2002) described him as “a notable scholar, with an unusual breadth of knowledge” (p. 93). In 1912, he authored Scientific Method: Its Philosophy and Practice, and new editions were issued in 1919, 1924, 1931, and 1937. In 1929, Westaway published Science Teaching: What it Was, What it Is, What Might Be. According to Jenkins, this book “was well-received by the reviewers and it became a staple of initial training courses for graduate science teachers” (p. 93).
According to Westaway (1919), science classes in the 19th century left much to be desired. “Thirty or forty years ago, such practical Science as was attempted in the few school laboratories then existing was of no appreciable value; the teaching was confined mainly to the lecture-room” (p. 369). He suggested that scientific method should be used in the teaching of science.
Science has one enormous advantage over all other subjects. All facts can be obtained at first hand, and without resort to authority. The learner is thus put in the position of being able to reason with an entirely unprejudiced mind. It is this possibility of self-elimination in forming a judgment that must be regarded as the greatest possible specific result of science teaching. (p. 6)
Pursue this discipline carefully and conscientiously, and we may make sure that, however scanty may be the measure of information which we have poured into the boy’s mind, we have created an intellectual habit of priceless value in practical life. (p. 49)
Let the Science teacher, then, be on his guard against dogmatizing. His chief business is to teach, not to lecture; to guide, not to tell. To lead his scholars to the pursuit and investigation of Truth should be his highest aim. (p. 50)
Westaway (1919) also reported the failure of teachers to provide lab experiences that incorporate scientific method:
The man who is working for a science degree usually takes on trust nearly all he is told in the lecture theatre . . . How can such a teacher be expected to engage in successful heuristic teaching when he himself has never in his life undertaken the simplest piece of research work? His outlook is altogether wrong. He sets to work in school exactly as he was taught to set to work at college. How, indeed, can he be expected to do otherwise? He is entirely unaware of the specific functions that science teaching is intended to perform. He teaches Science just as he would teach History. He considers it his sole duty merely to pass on information. The spirit of his work is, ‘Believe, and ask no questions.’ (pp. 4-5)
Modern Science Laboratories in Education
In the late 1900s, the National Science Teachers' Association (NSTA) in the United States agreed that laboratory experience is “so integral to the nature of science that it must be included in every science program for every student” (NSTA, cited in NSTA, 2005, ¶ 1). They give their rationale as follows: “The inquisitive spirit of science is assimilated by students who participate in meaningful laboratory activities. The laboratory is a vital environment in which science is experienced” (¶ 1). “Problem-solving abilities are refined in the context of laboratory inquiry. Laboratory activities develop a wide variety of investigative, organizational, creative, and communicative skills. The laboratory provides an optimal setting for motivating students while they experience what science is” (¶ 2). Indeed, the recommendations of the NSTA are that, in middle schools (ages 11-13), “a minimum of 80 percent of the science instruction time should be spent on laboratory-related experience” (¶ 16).
Others have echoed the concept that learning scientific methodologies has great value. Carl Sagan (1996) argues for the value in everyday life:
In the course of their training, scientists are equipped with a baloney detection kit. The kit is brought out as a matter of course whenever new ideas are offered for consideration. If the new idea survives examination by the tools in our kit, we grant it warm, although tentative, acceptance. If you’re so inclined, if you don’t want to buy baloney even when it’s reassuring to do so, there are precautions that can be taken; there’s a tried-and-true, consumer-tested method. (pp. 209-210)
Knuth, Jones, and Baxendale (1991) state: “A major aim of science education must be to help students to become good at ‘scientific thought’” (¶ 5), and makes essentially the same argument as Sagan. This is not a new argument. Westaway (1919) also spoke to this point 80 years earlier:
Children who are taught to think for themselves, to sift evidence, to get at all essential facts, are likely, later on, to prove formidable opponents to illogical systems . . . . The mass of mankind will never have any ardent zeal for seeing things as they are; very inadequate ideas will always satisfy them. (p. 48)
Simon Newcomb, a highly revered and decorated 19th century astronomer, writer, and teacher, who spent much of his life advocating the use of scientific method throughout society, “was convinced that the method, as opposed to the content, of science could and should be taught in the nation’s schools, thus creating a true program of liberal education” (Moyer, 1992, p. 26). John Dewey, “who dominated educational thought in the United States during much of the first half of the 20th century, later gave wide currency to this notion, continually calling for the teaching of scientific method in its largest sense” (Moyer, 1992, p. 26).
As in the early 1900s, many teachers today provide laboratory experiences that fail to result in the benefits touted by the NSTA. For example, Carl Sagan (1996) described exactly this failure of his own high school teachers:
There were rote memorization about the Periodic Table of the Elements, levers, and inclined planes, green plant photosynthesis, and the difference between anthracite and bituminous coal. But there was no soaring sense of wonder, no hint of an evolutionary perspective, and nothing about mistaken ideas that everybody had once believed. In high school laboratory courses there was an answer we were supposed to get. We were marked off if we didn’t get it. There was no encouragement to pursue our own interests or hunches or conceptual mistakes. (p. xiii)
Carl Sagan's experience illustrates the illusion of science laboratories that expose students to a laboratory setting and some techniques, without incorporating scientific processes. Bower (2004) restates this concept more recently:
Even programs that combine "science excitement lectures" with later "hands-on" experiments usually reinforce unproductive attitudes. For example, in most cases, the "hands-on" activities are do-it-yourself "cook-book" demonstrations . . . These are usually primarily intended to assure that everyone gets the same, right answer. (¶ 6)
The National Science Education Standards of the United States state: “Conducting hands-on science activities does not guarantee inquiry” (National Research Council, 1996, p. 23). Handelsman et al. (2004) and Trautman et al. (2002), for example, suggest reasons for the failure of teachers to implement laboratory experiences that use inquiry and scientific methodologies. Among these are inadequate exposure to science research, fear that experiments will fail unless carefully scripted, belief in efficacy of their current techniques, unfamiliarity with technology, and a need by teachers to know all of the answers. As a result, too many teachers send their students into the laboratory simply to replicate or verify that which they have already explained and illustrated in the classroom; they send them to an unexciting and probably non-educational experience.
Virtual Science Laboratories
A virtual laboratory (virtual lab) is simply a laboratory experience without the actual laboratory, and teachers have provided paper-and-pencil virtual labs for a long time (e.g., Muskopf, n.d.). In a paper and pencil lab, the data has already been collected. The student analyzes the data and draws conclusions, thus engaging in a restricted number of scientific processes only. This type of virtual lab is more accurately described as a virtual lab report.
For several years now, software vendors have provided computer-based virtual labs. These almost always show simulations of experiments based on computer algorithms, which are often simple equations. Typically, the student selects which simulation to watch, much like picking a scene to watch on a DVD. The scene may be animated, and would most likely include a graph and data table. Like the paper-and-pencil lab, the data are predefined, this time by the algorithm on which the simulation is based. The student watches the scene and might draw conclusions about the simulation, but does not engage in scientific process. This variety of virtual lab is more accurately described a virtual demonstration (demo) or simulated lab.
In the remainder of this paper, we discuss how technology can be used to create virtual labs that closely resemble real labs, and that require students to engage in scientific processes more broadly. We call this variety of virtual lab a real virtual lab.
Real Virtual Labs
We, along with our collaborators, sought a way to use computer technology to create real virtual labs, without the limitations of software-generated virtual demos. Further, we determined that real virtual labs must require students to engage in a broad range of scientific methodologies, thereby avoiding the failure of traditional labs to provide this experience.
Real virtual labs must include real experiments. The central activity in any lab is running experiments and collecting data. For this to succeed, a real virtual lab must include real experiments from which students can collect data that are not predefined. “Bacon [who may rightly be termed the father of scientific methodology], insisted on the importance of experiment, as well as on observation. He insisted on the necessity of collecting facts. He urged that authority must be disregarded” (Westaway, 1919, p. 94).
Compare this with what the student is investigating when performing a simulated lab. Science is understanding the world around us. To understand it, you must explore it. Yet, with a simulation you are exploring an algorithm, an abstraction that attempts to model the real world. Any discovery you may make is a discovery about the algorithm, not about the world.
Rather than using algorithms to create artificial data, students should use real experiments. Once we made this decision, many new issues arose. In a virtual setting, students will not have direct access to equipment. We chose the solution of making the computer appear to have access to a remote robotic laboratory that accepts instructions and returns a video of the experiment. Students can view this video repeatedly and stop it at individual frames to collect data. Appropriate software converts the data collection mouse clicks into real units and displays them both in a data table and on a graph. The next section contains an example.
Whatever the mechanism, students must believe that they are working with real world phenomena, so they know they're exploring the real world. Because the experiment is real, students will accept taking data point by point. Note the contrast with a simulation, where point-by-point data collection from an equation (or algorithm) makes no sense, because the numbers are already there.
Real virtual labs must incorporate scientific methodologies. The primary goal in any lab is to engage in scientific processes. To achieve this goal, a real virtual lab needs to control the steps the students must perform in order to complete the lab. For example, given a particular question being investigated, students might be required to test one or more predictions--predictions they have made themselves and/or which have been provided by the technology. In order to complete the lab, the students might be required to perform these steps:
Write (or read and select) one or more predictions.
Select an experiment to test a prediction, and run it.
View the experiment and collect data interactively.
Analyze the data (including comparing graphs).
Evaluate the prediction (i.e., accept it, refute it, or revise it).
Repeat the above steps as necessary.
For students to engage in the experimental design phase, the technology must provide a large number of experiments, from which students may choose, to evaluate their prediction(s).
An Example of a Smart Science Lab
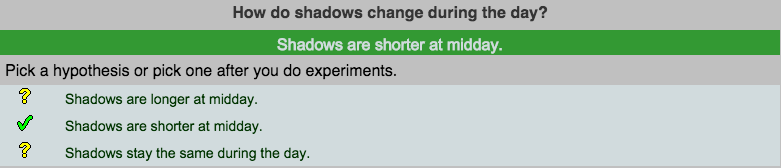
An example from our suite of over 200 labs will help explain how Smart Science software employs technology to create an authentic laboratory learning experience. All labs begin with an introductory exercise that includes a brief background and a pre-lab assessment. Many also include an engaging video. In the Shadows lab, students are invited to investigate how shadows change during the day and on different days.
The experiments were recorded on a flat rooftop in Southern California. A flat piece of plywood with a vertical gnomon provided the shadow location. One camera recorded shadows while a second one with a fisheye lens recorded the passage of the Sun across the sky.
First, students write a prediction, or view those supplied (Figure 1). We note the call to better distinguish between a prediction and a hypothesis (e.g., Eastwell, 2002), and that what is presently called a hypothesis in the software (as exemplified in Figure 1) would be considered by some others to be better termed a prediction (the term we have chosen to adopt in-text). Instructors may choose to use whichever term they prefer as one of many customizable features of this system.
Figure 1.
An example of prewritten predictions.
© 2015 by Smart Science Education Inc., California, U.S.A.
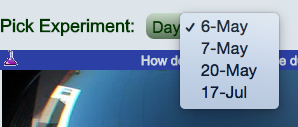
Figure
2. Parameter selection example.
|
They view the experiment (Figure 3) one or more times. Then, data are collected point by point. As each video frame is displayed, a student very carefully clicks on the projectile. A dark gray X appears at the click point (Figure 3), a data pair appears in the data table (Figure 4), and a black X appears on the graph of vertical velocity against time (Figure 4). Both Figures 3 and 4 appear on the same screen. Students can click anywhere in a given frame, or even skip frames, so no two students will have exactly the same data. Sloppy or incomplete data collection will result in poorer results, which are very evident in the lab report that is submitted. If a student decides that the data are poor, or the instructor tells the student to redo one or more experiments, the experiments are readily repeated. Only the latest data for each experiment is stored in the database.
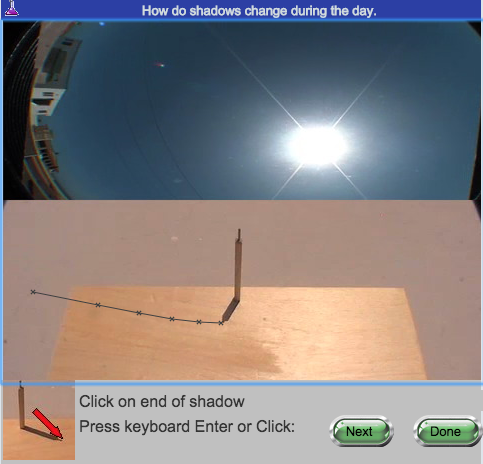
Figure 3.
Data capture for Shadows lab.
|
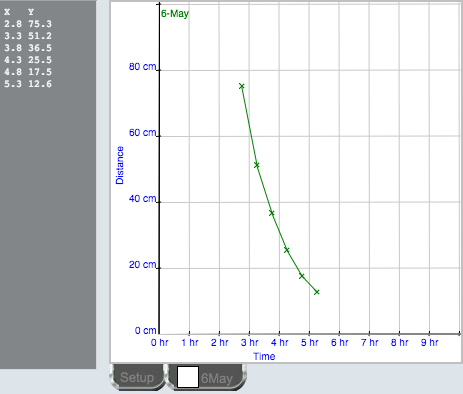
Figure 4.
Data table and graph for Shadows lab.
|
To make comparing results from different experiments easier, appropriate labs have an "all graph" function (Figure 5). Here, you can see the trace of a shadow on three different days. The tabs below provide the legend for the graph and allow you to choose a particular graph to view and/or experiment to run.
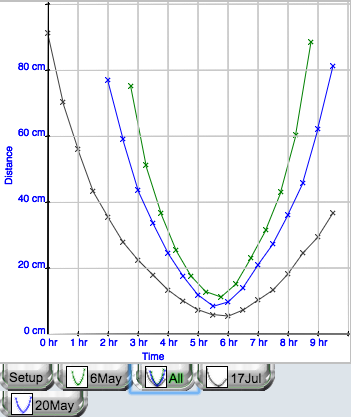
Figure 5.
An example of an "all graph".
|
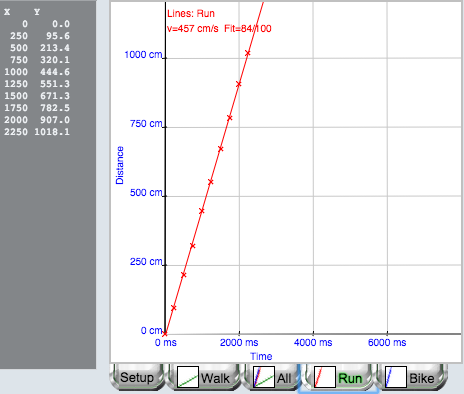
Figure 6.
Data table and graph for Line Graphs lab.
|
In some labs, a least squares algorithm is used to fit a straight line to the data, which provides one or more fit parameters to students (Figure 6). In Figures 5 and 6, you can also see tabs for other experiments in this lab done by this student, each with an icon that displays the student data. Students can readily view any “page” in this electronic lab notebook by clicking on one of these tabs.
Students continue to choose, and perform, experiments until they are satisfied that they have reached an appropriate conclusion about their prediction(s), they can gain no further understanding from doing more experiments, or they run out of experiments. With Smart Science labs in general, it is beneficial even to provide some experiments where the parameters are such that the experiment is of no use at all in answering the question being addressed, as this can further promote students’ understanding of experimental design. Note that, in Figure 1, these students had chosen one prediction and not made any commitment about the others. An eliminated prediction will be preceded by a large red X. this lab, students should come to understand that shadows are shorter at midday. They may also note that July has longer shadow time than May and shorter midday shadows.
Following experimentation, students engage in a post-lab assessment, review the goals and objectives of the activity, and use the built-in provisions to write an electronic lab report. For each experiment, all three types of data display (i.e., points in context, data table, and graph) are replicated in the lab report. The written portion of the lab report may comprise four parts (each with guidance on what to write): Introduction, Procedure, Results, and Conclusions. It may have more or fewer sections depending on choices made by the instructor and may also have additional essay questions in many cases.
Some Specifics of Smart Science Lab Technology
In the above Figure 6, vertical positions (converted to distance) were plotted against frame number (converted to time). However, many other options are available for converting mouse clicks into data. In some projectile motion labs, the x-position is plotted against time, the y-position is plotted against the x-position, and the kinetic energy is plotted against potential energy. In another lab, vertical position (converted to force on a spring scale) is plotted against frame number (converted to mass). In biologylabs, numbers of seeds germinated is plotted against time or numbers of cells in each phase of mitosis are shown as bar graphs.
Labs like Density, Gas Volume-Temperature, Erosion, Enzymes, and Liquid Volume-Temperature will, of course, not track an object, but they still measure position. The Acid-Base Titration, Phases of the Moon, Yeast Metabolism, Voltage and Brightness, and other labs measure things other than position. Nevertheless, the videos have always been arranged so that the mouse cursor is the data collection device, although some labs, such as Oxidizing Power, have the student read a value (here, a burette reading) and type it into the system.
The basic engine used to deliver Smart Science labs consists of a HTML5 pages automatically loaded on the student computer and Java servlets on the server. HTML5 makes the entire package platform independent. The basic configuration for a given lab is provided by an XML file, which is compiled and stored on the server.
Benefits and Limitations of Real Virtual Labs
Real virtual labs have some obvious benefits over traditional labs, including lower cost, greater safety, less time to complete, and smaller space requirements. Other benefits provided by the computer technology include student guidance, immediate support, tracking, and accountability.
Student guidance. Guiding a group of students through the inquiry process, while at the same time allowing sufficient freedom for discovery, is a truly difficult task.
Young scholars cannot be expected to find out everything for themselves, but the facts must always be so presented to them that the process by which results are obtained is made sufficiently clear as well as the methods by which any conclusions based on facts are deduced. (Armstrong, cited in Westaway, 1919, p. 370)
With today's large class sizes, the task becomes insurmountable. The technological solution is to build the guidance into the software, to provide boundaries to exploration that gently channel the student toward the goals of the instructional unit while allowing real science to take place. By choosing the experiments and support materials, the lab designer limits the range of exploration to something manageable, while still allowing for inquiry, exploration, and discovery.
Hypothesis-based exploration. Writing (or reading) predictions, with the goal of evaluating them by experiment, helps to channel students' investigations and constitutes the core of a scientific approach. Students lacking sufficient sophistication to write their own predictions are presented with an already-written set, and they work to eliminate all but one through experiment.
Once a single prediction remains, students should use further experiments to confirm that the conclusion remains valid. The exploration is not completely open-ended, and students also do not simply do all of the experiments and then see what they can figure out from them. Of course, they have to defend their conclusion(s) in their lab reports.
Modularity and customizability. The choice of a computer-based activity automatically provides the possibility for substantive modifications to meet individual situations. Through interactions with many different schools and teachers over several years, we have arrived at a list of potential customizations. The system was created to be modular and very flexible. Some examples of custom changes are listed here. They're truly limited only by imagination and programming skill.
Allow or disallow curve fit.
Choose the word “hypothesis” or “prediction” to describe initial student action.
Change the predictions given, or allow students to write their own.
Replace support materials like vocabulary or background information.
Allow students to retake assessments until a minimum grade is attained.
Provide lower or higher reading and mathematical levels.
Translate the written material, button labels, and the like into up to 80 languages using Google Translate®.
Other benefits of a technology-based system. A learning system based on computer technology should provide much more than the presentation of material alone. Students interacting with computers to experiment and understand generate a generous flow of incidental data, which should be captured. In addition, the computer can provide a plethora of learning aids.
With all student data stored in a database, the computer system can generate a variety of useful reports, for teachers and administrators, in real time. The database approach also has benefits for students, who can review previous work and update it. Dynamic web pages present the student data in ways that increase understanding.
Because the students interact with a computer, they can be provided with help immediately. The system should also provide assistance in the form of vocabulary definitions, fully worked-out answers to all questions, and explanations of aspects of the lab such as apparatus, possible errors, and units. The system can also provide hints on how to solve assessment questions, and even sample worked-out questions. A computer-based lab system should aim to have students achieve mastery of the science concepts with minimal resort to the instructor. Teachers can also be provided with additional support, in the form of online information for each lab similar to that found in the Teacher's Edition of a textbook.
Limitations of real virtual labs. No learning system is perfect, and maximal learning is best achieved using a variety of approaches. We therefore encourage teachers also to include learning experiences other than virtual labs in their programs. Any completely computer-based learning approach must sacrifice the tactile and kinesthetic aspects of a traditional laboratory, and with it some learning opportunities. Students will not feel, taste, or smell the experimental materials. For example, feeling the resistance of large masses to efforts to move them promotes an understanding of mass and inertia. Tasting baking soda and vinegar can help to develop an understanding of acids and bases.
No matter how many experiments have been prerecorded for a lab, a situation may arise where students desire a parameter set that has not been included. Of course, feedback to the lab developer may result in the addition of more experiments—but not in time for present students.
Conclusion
The challenges of today's science classroom require new solutions. Technology provides one way to help science teachers overcome obstacles and improve the learning outcome. The biggest challenge lies in the laboratory, because quality lab experiences aren't being provided as often as they should be, and because the laboratory is where students have the opportunity for first-hand experience of the methods and thought processes of science. In the lab, they may emulate activities of scientists.
Most technological substitutes for labs are really just computer-based demonstrations that miss the essential elements of science methodology. The alternative presented here uses real experiments, together with hands-on measurement and built-in scientific processes, to ensure that the important features of the lab are not lost. In addition, the computer software provides a means to channel the students' activities, to measure their performance, and to support their learning.
While the use of real virtual labs can result in a loss of some aspects of a traditional lab, their proper use can often more than compensate for this loss. The Smart Science system briefly described here has been in development and testing for 15 years, and has delivered over one million lab experiences to date. Students and teachers have found it easy to use, engaging, and a valuable aid to learning science.
* Smart Science is a trademark of Smart Science Education Inc., California, USA. The technology used in the Smart Science education system is patented in the United States of America.
Editor: The authors invite researchers interested in evaluating the Smart Science program to contact them.
Bower, J. M. (2004). Scientists and science education reform: Myths, methods, and madness. Retrieved January 3, 2005, from http://www.nas.edu/rise/backg2a.htm .
Bruder, I. (1993). Redefining technology and the new science literacy. Electronic Learning, 2(6), 20-24.
Eastwell, P. H. (2002). The nature of science. The Science Education Review, 1(2), 43-48.
Friedrichsen, P. M., Dana, T. M., Zembal-Saul, C., Munford, D., and Tsur, C. (2001). Learning to teach with technology model: Implementation in secondary science teacher education. Journal of Computers in Mathematics and Science Teaching, 20, 377-394.
Handelsman, J., Ebert-May, D., Beichner, R., Bruns, P., Chang, A., DeHaan, R., Gentile, J., Lauffer, S., Stewart, J., Tilghman, S., & Wood, W. (2004). Scientific teaching. Science, 304, 521-522.
Harlen, W. (n.d.). Understanding and teaching science. Retrieved January 26, 2005, from http://www.scre.ac.uk/rie/nl57/NL57ArticleHarlen.html .
Jenkins, E. W. (2002). Who were they? F. W. Westaway (1864-1946). School Science Review, 83(302), 91-94.
Knuth, R. A., Jones, B. F., & Baxendale, S. (1991). What does research say about science? Retrieved January 3, 2005, from http://www.ncrel.org/sdrs/areas/stw_esys/3science.htm Site no longer available. .
Moyer, A. E. (1992). A scientist's voice in American culture. Berkeley: University of California Press.
Muskopf, S. (n.d.). The Biology Corner Retrieved January 7, 2005, from http://www.biologycorner.com/worksheets/fossilrecord.html .
National Research Council. (1996). National science education standards. Washington, DC: National Academy Press.
NSTA. (2005). NSTA position statement. Retrieved January 3, 2005, from http://www.nsta.org/159&psid=16 (no longer online) .
Smart Science Education (2004). Smart Science. Retrieved December 8, 2004, from http://smartscience.net .
Sagan, C. (1996). The demon-haunted world: Science as a candle in the dark. New York: Random House.
Trautman, N., Avery, L., Krasny, M., & Cunningham, C. (2002). University science students as facilitators of high school inquiry-based learning. Retrieved January 26, 2002, from http://ei.cornell.edu/pubs/CEIRP_NARST_02.pdf .
Westaway, F. W. (1919). Scientific method: Its philosophy and practice. London: Blackie & Son.
Woodrow, J. E. J., Mayer-Smith, J. A., & Pedretti, E. G. (2000). Assessing technology-assisted instruction: A case study in secondary science. Journal of Educational Computing Research, 23(1), 15-39.
The Science Education Review (SER) is an international, peer-reviewed periodical aiming to provide primary and high school teachers with the latest, and best, ideas in science education from around the world. SER also publishes original articles, including research articles, and much more.
Please visit The Science Education Review at www.ScienceEducationReview.com . SER On-Line offers individuals and institutions password and/or IP authenticated access to the content of all issues of SER.
Contributions are welcome, as are expressions of interest in joining the Editorial Review Board. The latter role requires the periodic review of submitted contributions, and is not onerous. Comments, questions, and article proposals may be sent to The Editor, Dr Peter H. Eastwell, at editor@ScienceEducationReview.com .
* * *